EUR / USD1.0842+0.17%
GBP / USD1.2734-0.24%
USD / NOK10.8421+0.47%
EUR / NOK11.7603+0.20%
GBP / NOK13.8162-0.25%
USD / JPY157.42+0.24%
EUR / GBP0.8514+0.11%
USD / CHF0.8921-0.16%
EUR / USD1.0842+0.17%
GBP / USD1.2734-0.24%
USD / NOK10.8421+0.47%
EUR / NOK11.7603+0.20%
GBP / NOK13.8162-0.25%
USD / JPY157.42+0.24%
EUR / GBP0.8514+0.11%
USD / CHF0.8921-0.16%
Illustrative

FX Risk Management

No less than.
No more than.
Known.

Sum No How gives mid-market corporates real-time visibility into currency risk, so finance teams can hedge confidently and boards can sleep soundly.

EUR / NOK Illustrative
EUR / NOK
11.7603
+0.0234 (+0.20%)
Hedge cover: 78%

Currency risk hits hardest
when you can’t see it coming.

Mid-market corporates trading in EUR, GBP, or USD face margin erosion from exchange rate moves, yet most still manage FX exposure on spreadsheets or not at all.

Exposure dashboard ⚠ Breach
EUR / NOK receivables EUR 1,240,000
GBP / NOK payables EUR 680,000
USD / NOK hedged EUR 420,000
0%
Hedge utilisation
  • Invisible exposure
    Receivables in EUR, payables in NOK, the net position is a moving target that spreadsheets can’t track in real time.
  • Reactive, not proactive
    Finance teams find out about breaches when the invoice arrives, not when the rate moves. By then, margin is already gone.
  • Board reporting blind spots
    FX risk is often absent from board packs or buried in footnotes, making it impossible to govern confidently.

Everything your finance team needs
to stay ahead of currency risk.

Live exposure dashboard
Consolidated view of all open positions across EUR, GBP, USD and NOK, updated in real time from your ERP or uploaded directly.
Breach alerts
Set exposure thresholds by currency pair or total portfolio. Get notified the moment a rate move puts your margin at risk.
Hedge calculator
Model forward cover scenarios using your actual exposure data. See break-even rates and worst-case outcomes before you trade.
Board-ready reporting
One-click PDF and Excel exports for audit committees and risk committees. No reformatting, no manual data entry.
ERP integrations
Native connectors for Visma, Tripletex, and Microsoft Dynamics. Pull open invoices and payables automatically, no CSV uploads.
Bank-agnostic
Sum No How sits alongside your existing banking relationships. We provide the visibility; your bank executes the hedge.

See the exposure data
your board needs to see.
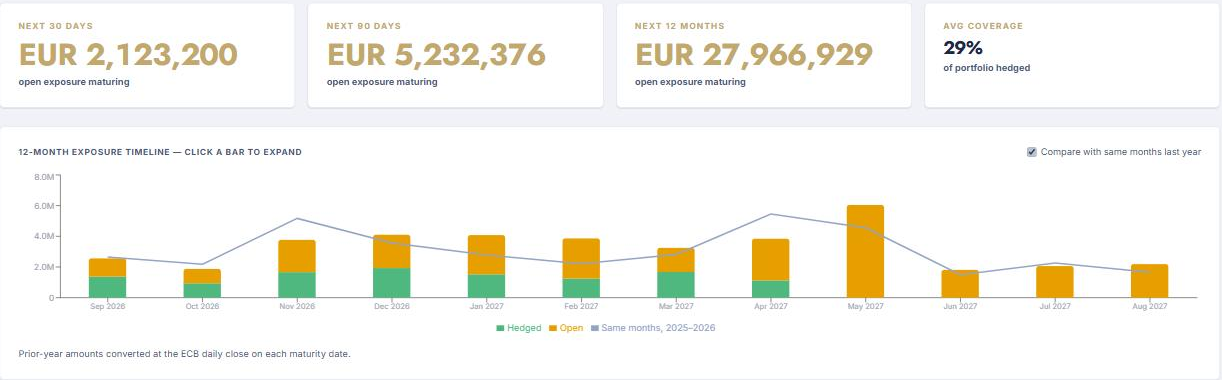
SNH Treasury Console exposure forecast: open exposure maturing over the next 30 days, 90 days and 12 months, average hedge coverage, and a twelve-month hedged-versus-open timeline with a prior-year comparison line.

Up and running in four steps.

01
Connect your data
Link your ERP or upload a spreadsheet. Your open positions populate the dashboard automatically.
02
Set your thresholds
Define acceptable exposure levels by pair and by total portfolio. We monitor them continuously.
03
Get alerted early
When rates move toward your threshold, you’re notified before it becomes a breach, not after.
04
Report with confidence
Export board-ready reports in one click. Every position, every hedge, fully documented.

Built for the team that owns
currency risk in practice.

Finance Director
Full control, zero surprises
See your complete currency position at a glance. Set the policy, monitor compliance, and brief the board with confidence.
  • Live portfolio exposure view
  • Policy threshold alerts
  • Board report exports
Treasury / FX Manager
Act before rates move
Real-time pair monitoring, hedge modelling, and deal tracking, all in one place, without switching between systems.
  • Multi-pair live rates
  • Forward scenario modelling
  • Hedge cover tracking
CFO / Board
Govern what you can see
FX risk belongs in the boardroom. Sum No How surfaces it clearly, quantified, contextualised, and auditable.
  • Quantified risk statements
  • Regulatory-ready audit trail
  • Scenario sensitivity outputs

See what a rate move
costs your business.

FX Exposure Calculator
Enter your exposure details to see your worst-case loss at 95th-percentile volatility.
Total exposure
Unhedged exposure
Period volatility (annualised → period)
Worst-case loss (95th percentile)
Modelled reduction in worst-case loss

95th percentile estimate using 1.645σ. Annualised volatility derived from 12-month historical data. Not investment advice.
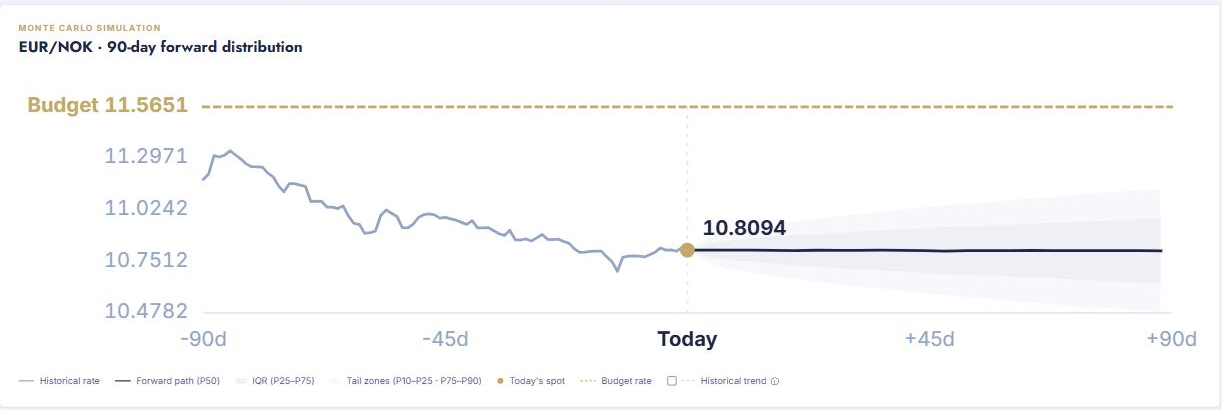
SNH Risk Engine Monte Carlo simulation: 90-day forward distribution for EUR/NOK showing the historical rate path, forward median, interquartile band, tail zones and budget rate.
Get started

Protecting margins
starts with visibility.

Join the waitlist for early access.

Book a meeting